Contenido
- turbulence.Sensor
- turbulence.Sensor.graph_AllVariables
- turbulence.Sensor.backup
- turbulence.Sensor.diff_lists
- turbulence.Sensor.heatmap_percent
turbulence.Sensor
class turbulence.Sensor(name = None, database = 'Processed', type_data = 'Flux', days = None, all_range = False, all_record = False, temp_resolution = None, type_v = 'rawdata')
Parameters:
- name: String type. Name used to identify the sensor in the database. You can use any of the names within the list:
xxxxxxxxxx[IRGASON_Candelaria, IRGASON_Federico_Carrasquilla, IRGASON_SENA,IRGASON_CASD_10M, IRGASON_ITM, IRGASON_Villa_Niza, IRGASON_CASD_20M,IRGASON_Jesus_Maria_Valle, IRGASON_Villa_Socorro,IRGASON_CASD_30M,IRGASON_Altavista, CSAT3B_MED_FISC]database: Search database. Default is Processed. It can be 'Processed' or 'Raw'. 'Processed' coresponds to databases with procesing by software EasyFlux or EddyPro. 'Raw' corresponds to raw data measured at 0.5s resolution.
type_data: Just functional to database = 'Processed'. Use it to define if you want processed data from EasyFlux with the string 'Flux', which has values every 5 min. On the other hand, you can call processed data from EddyPro, which has values every 30 min, corresponding to flux averaging period. This database has three possibilities:
- 'stats' to statistical information.
- 'fluxnet' that is a output file conforming to FLUXNET and
xxxxxxxxxxAmeriFlux's FP-In Standards for labels, units, and format; presentvariables as y intermediate results, statistics on all, high-frequencyvariables, covariances between all high-frequency variables, biometmean values and metadata.- 'full_output' that is the most comprehensive output file produced
xxxxxxxxxxby EddyPro. It contains many of the intermediate and final variablescalculated during data processing, as turbulence, air propierties,Gas densities, concentrations, and time lags.days: Int, list or None. Default is None. Format to dates in list must be '%Y-%m-%d'. If it is int, a DataFrame is obtained with data from the current day to the number of days back. If you enter a list with dates is obtained a DataFrame with data for the day, or with data ranging from the first date to the second date, or data on each of the dates of interest. If is None, is used to the files corresponding to the backup process.
all_range: Bool. Just used in the case that days contain two dates. Default is False. When two dates are entered, define if you want data from the start date to the end setting as True. If you want only the data for the two dates, set it to False.
all_record: Bool. Default is False. If you want all the data available in the database.
temp_resolution: Temporary resolution of de data as str. Default is None. If is changed, the data is resample to the temp_resolution given, using the average of the data.
type_v: String with type of mesurements. Use it just with database as "Rawdata" or with data from EasyFlux. It can be 'rawdata' or 'anomalies'. Default is 'rawdata'. If you pass 'anomalies', it is calculated as:
xxxxxxxxxx anomaly = value - average corresponding to 30minExamples
Calling raw data from last 1 day ago and
xxxxxxxxxximport turbulence as tblsensor = tbl.Sensor(name = 'IRGASON_Candelaria', database = 'Raw', days = 1)sensor.data.head(2) RECORD Ux Uy Uz T_SONIC diag_sonic CO2_density CO2_density_fast_tmpr H2O_density diag_irga T_SONIC_corr TA_1_1_1 \TIMESTAMP 2021-02-01 00:00:00.000 734805874.0 -4.834607 4.379913 0.158119 21.43830 0.0 560.1277 566.8666 5.880885 0.0 20.53098 18.419072021-02-01 00:00:00.050 734805875.0 -4.639253 3.889415 0.359624 21.45966 0.0 559.9778 566.7234 5.883626 0.0 20.54474 18.41907Calling data in multiples dates
xxxxxxxxxximport turbulence as tblsensor = tbl.Sensor(name = 'IRGASON_Candelaria', database = 'Raw', days = ['2021-01-03', '2021-01-08', '2021-01-23'])sensor.data['2021-01-03'].head(1) RECORD Ux Uy Uz T_SONIC diag_sonic CO2_density CO2_density_fast_tmpr H2O_density diag_irga T_SONIC_corr TA_1_1_1 \TIMESTAMP 2021-01-03 00:00:00.000 669515869.0 -1.001235 -0.629053 0.192574 20.28459 0.0 583.0040 589.5051 8.501230 0.0 18.97537 16.88681xxxxxxxxxxsensor.data['2021-01-08'].head(1) RECORD Ux Uy Uz T_SONIC diag_sonic CO2_density CO2_density_fast_tmpr H2O_density diag_irga T_SONIC_corr TA_1_1_1 \TIMESTAMP 2021-01-08 00:00:00.000 678155867.0 -0.045016 1.057542 -0.215736 19.21257 0.0 601.8800 608.2081 8.742453 0.0 17.88049 15.90817xxxxxxxxxxsensor.data['2021-01-23'].head(1) RECORD Ux Uy Uz T_SONIC diag_sonic CO2_density CO2_density_fast_tmpr H2O_density diag_irga T_SONIC_corr TA_1_1_1 \TIMESTAMP 2021-01-23 00:00:00.000 704075845.0 -1.215571 -0.527850 0.243547 20.39452 0.0 590.7277 597.3887 7.602690 0.0 19.21924 17.13992Calling data in a time range
xxxxxxxxxximport turbulence as tblsensor = tbl.Sensor(name = 'IRGASON_Candelaria', database = 'Raw', days = ['2021-01-03', '2021-01-05'], all_range = True)sensor.data['2021-01-03'].head(1) RECORD Ux Uy Uz T_SONIC diag_sonic CO2_density CO2_density_fast_tmpr H2O_density diag_irga T_SONIC_corr TA_1_1_1 \TIMESTAMP 2021-01-03 00:00:00.000 669515869.0 -1.001235 -0.629053 0.192574 20.28459 0.0 583.0040 589.5051 8.501230 0.0 18.97537 16.88681xxxxxxxxxxsensor.data['2021-01-04'].head(1) RECORD Ux Uy Uz T_SONIC diag_sonic CO2_density CO2_density_fast_tmpr H2O_density diag_irga T_SONIC_corr TA_1_1_1 \TIMESTAMP 2021-02-01 00:00:00.000 671243869.0 -1.239332 0.734344 -0.006824 18.49572 0.0 590.5066 596.6470 6.639220 0.0 17.48788 15.10754xxxxxxxxxxsensor.data['2021-01-05'].head(1) RECORD Ux Uy Uz T_SONIC diag_sonic CO2_density CO2_density_fast_tmpr H2O_density diag_irga T_SONIC_corr TA_1_1_1 \TIMESTAMP 2021-02-01 00:00:00.000 672971869.0 -0.747220 0.039915 0.138287 18.86970 0.0 601.1432 607.4532 6.765558 0.0 17.83746 15.92487Changing the resolution of data
xxxxxxxxxximport turbulence as tblsensor = tbl.Sensor(name = 'IRGASON_Candelaria', database = 'Raw', days = ['2021-01-03'], temp_resolution = '30T')sensor.data['2021-01-03 05'].head(2) RECORD Ux Uy Uz T_SONIC diag_sonic CO2_density CO2_density_fast_tmpr H2O_density diag_irga T_SONIC_corr TA_1_1_1 \TIMESTAMP 2021-01-03 05:00:00 669533868.5 0.262761 0.748647 0.032138 20.225458 0.0 595.617024 602.176873 9.265051 0.0 18.801197 16.8450532021-01-03 05:30:00 669569868.5 0.106879 0.111703 0.051869 20.460105 0.0 592.873733 599.503337 9.158846 0.0 19.050288 16.897682Calculating anomalies with the data
xxxxxxxxxximport turbulence as tblsensor = tbl.Sensor(name = 'IRGASON_Candelaria', database = 'Raw', days = ['2021-01-03'], type_v = 'anomalies')sensor.data['2021-01-03 05'].head(2) RECORD Ux Uy Uz T_SONIC diag_sonic CO2_density CO2_density_fast_tmpr H2O_density diag_irga T_SONIC_corr TA_1_1_1 TIMESTAMP 2021-01-03 05:00:00.000 -17999.5 -1.263996 -1.377700 0.160436 0.059132 0.0 -12.613024 -12.671773 -0.763821 0.0 0.174173 0.0417572021-01-03 05:00:00.050 -17998.5 -1.305568 -1.344858 0.156411 0.058482 0.0 -12.378624 -12.435573 -0.761592 0.0 0.175703 0.041757turbulence.Sensor.graph_AllVariables
turbulence.Sensor.graph_AllVariables(show_figure = False)
Returns a bokeh object of the variables that the sensor measures, this object can be export to HTML. If the database is Flux, it also gives a graph of the turbulent flows
Parameters:
- show_figure: Default is False. Option to show or not the figure
Examples
Generating interactive graphs for the variables processed in EddyPro. It is recommended not to use this function with the 'Raw' database since the temporal resolution is too high so the graphing process may hang, if it is necessary to use this database, modify the temporal resolution of the data using temp_resolution or type_v when generating the object Sensor
xxxxxxxxxximport turbulence as tblsensor = tbl.Sensor(name = 'IRGASON_Candelaria', database = 'Processed', type_data = 'Flux', days = 1)sensor.graph_AllVariables(show_figure = True)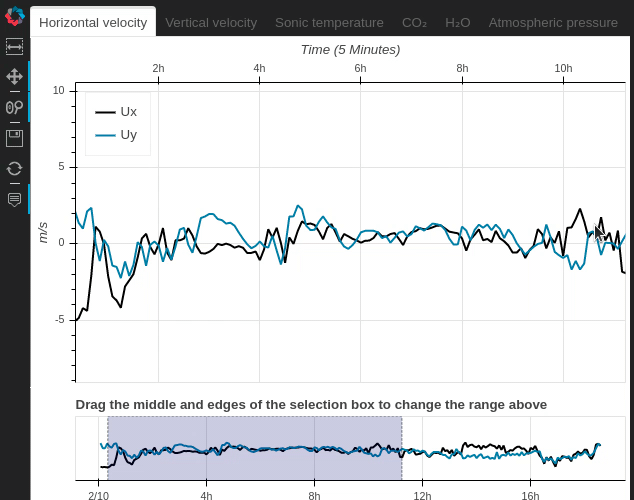
turbulence.Sensor.backup
turbulence.Sensor.backup(folder_backup, show_figure = False)
This function is only used in backup periods, for more information here. The files available for backup are analyzed based on:
- Has titles
- Starts close to 00:00:00
- Ends close to 23:59:59
- The file name matches the data in the file
- Which file has more information, the time real file or the
Parameters:
- folder_backup: Path to the folder containing the backup files
- show_figure: Default is False. Option to show or not the figure
Examples
xxxxxxxxxximport turbulence as tblsensor = tbl.Sensor(name = 'IRGASON_Candelaria', database = 'Raw', days = None) #It's appropriate to make sure to set days as None and necessary set database as 'Raw', to perform a backup processpath_backup = 'Datos_2020_12_02'sensor.backup(folder_backup = path_backup, show_figure = True)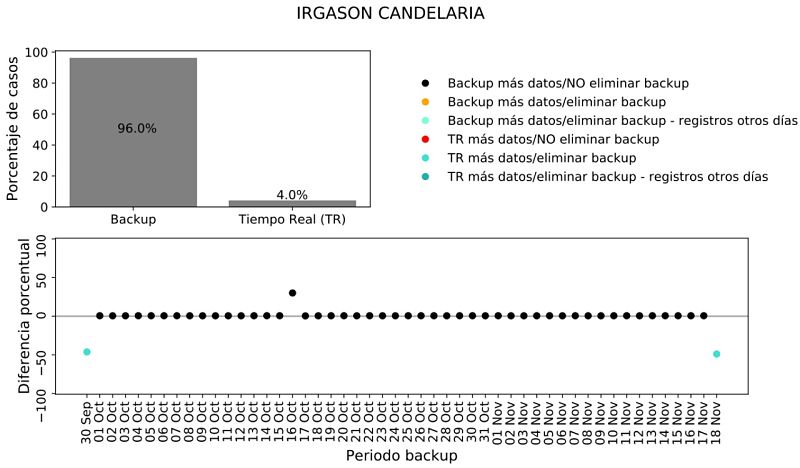
turbulence.Sensor.diff_lists
turbulence.Sensor.diff_lists(li1, li2)
Evaluate which elements of list 1 are not found in list 2
Parameters:
- li1: List object
- li2: List object
Returns:
- List object
Examples
xxxxxxxxxximport turbulence as tblsensor = tbl.Sensor(name = 'IRGASON_Candelaria', database = 'Raw') #It's necessary set database as 'Raw' to generate a Sensor object without problemsl1 = ['java', 1, 2, 'a']l2 = [2, 5, 1, 'b', 'python']sensor.diff_lists(l1, l2)['java', 'a']turbulence.Sensor.heatmap_percent
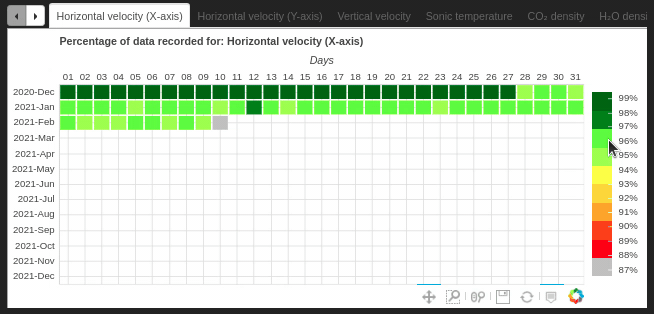
turbulence.Sensor.heatmap_percent(data = None, style='Bokeh', fig_size = (14,7), colorbar=False, show_figure = False, save_fig=False)
Create an interactive heatmap using the bokeh library, displaying the sensor's data record, throughout the year.
Parameters:
- data: DataFrame with data to calculate record percentage. If is None then the data of the Sensor object will be used
- style: String. Can be 'Bokeh' or 'plt' to select the library to use
- fig_size: Tuple with ints to set the width and height of the figure
- colorbar: Bool. Default is False. Change to True to watch a colorbar next to the graph
- show_figure: Default is False. Option to show or not the figure
- save_fig: Default is False. Option to save the figure as PDF just if style parameter is 'plt'
Returns:
Examples
xxxxxxxxxximport turbulence as tblsensor = tbl.Sensor(name = 'IRGASON_Candelaria', database = 'Raw', days = 1)sensor.heatmap_percent(colorbar = True, show_figure = True)